Insights / Netflix Data / Trend Report: New SVOD Strategies Transform Viewer Behavior
Netflix Data / 18th September 2024

The data is in: As premium streaming services shift content strategy to meet consumer taste and the rising pressure on profitability, viewing habits continue to change.
In other words, Tiger King is no longer king. Today, the average streaming user may be watching old episodes of Suits on an ad-supported subscription plan instead. Netflix Originals used to account for the most viewing hours among U.S. and global streaming platforms. According to recent viewership data, however, that trajectory has changed.
To give meaning and context to this shift, Digital i created the first in a new series of Trend Reports. These reports will examine the intersection of viewer behavior and current streaming content strategy. In evaluating the overall SVOD landscape, the increase in ad-supported programming, and post-“peak” TV trends, Digital i analyzed viewing data by highlighting consumer insights and new approaches for profitable streaming operations.
Download the Trend Report here, along with a pre-recorded webinar to guide you through our findings. This series of Trends Reports will focus on key industry questions and important markets.
According to the data, between July ’23 and July ’24, SVOD use increased 7% overall. At the same time, the share of households containing a 16-34-year-old viewer increased from 54% to 60%. As the streaming audience got larger and younger, it shifted away from Netflix—over the same year-on-year period, the platform’s share dropped by 6%.
Though their share is down, Netflix remains the first-choice major platform, still capturing two-thirds of the four major streamers U.S. viewing time combined.
As ad-supported subscriptions increase across platforms, streaming services are having a variety of outcomes with enrollment and engagement. Seventy percent of Prime Video users are on an ad-supported plan, compared to Netflix’s 20%. However, Netflix leads in engagement levels with premium ad-free members who watched an average of nearly 2.5 hours per day in the first half of 2024.
Find out more by downloading the Trend Report.

But what is everyone watching for 2.5 hours a day? Increasingly, it’s licensed programming more than original content. The Hollywood strike stopped production on Originals, and streamers relied on old shows to fill in the gaps.
The increased availability of archived programs with multiple seasons combined with the rise of viewing time during the pandemic created the Netflix Accelerator Effect. This environment gave media executives the opportunity to drive revenue with increased viewership of licensed content. This shift also resulted in limiting the residual bonuses for content creators made during the Hollywood strike.
The long-term effect of encouraging viewers to watch Suits, Suits, and more Suits for the next several years remains to be seen, however.
This report contains the kind of critical analysis we offer clients, using our viewership data to provide consumer insight central to global entertainment revenue strategies. Stay tuned for more reports in the coming months.
JOIN THE REVOLUTION
DIGITAL-I.COM
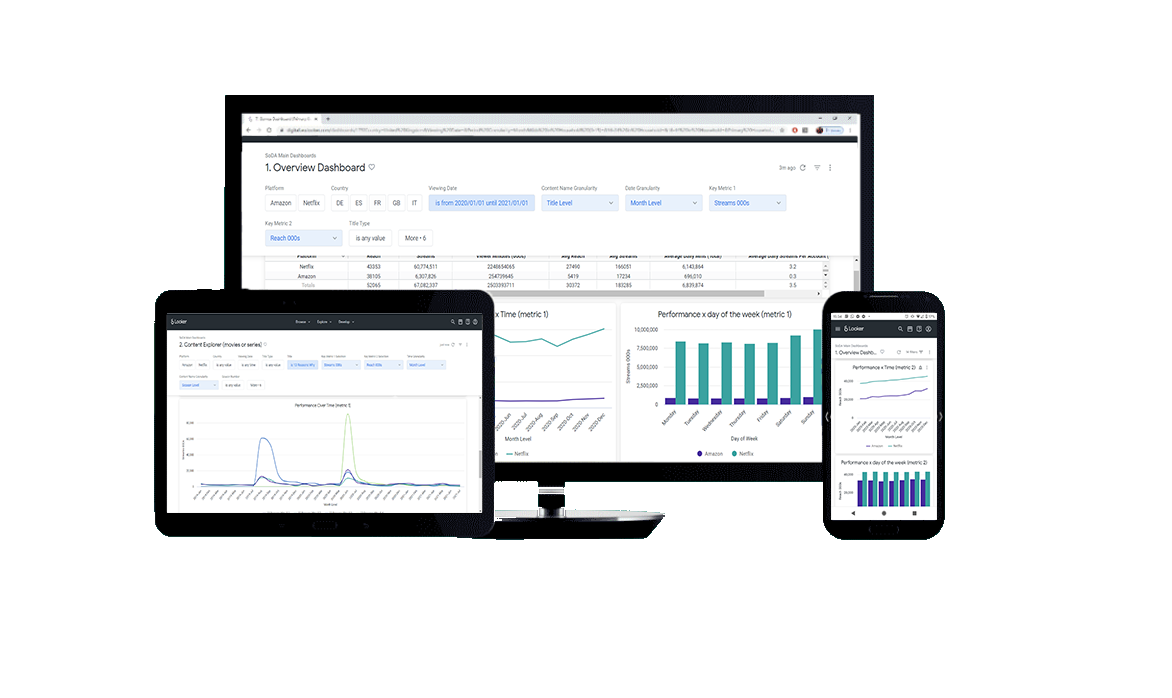
Speak to an expert to find out how our intelligence platform will revolutionise your TV reporting & SVOD research
